Musings

Volatility is not risk;  still water does not imply a lack of crocodiles.

With plenty of people angry about the auto-maker bailout, I’m personally disappointed that the terms of the deal were not also applied to the TARP.  It’s generally a good deal, unlike the windfall of un-encumbered cash the financials got to spend on bonuses and buyouts.

In the next few days, probably sometime next week, I will likely open some long positions in the market.  I expect to hold them for a few months at most. There are signs that the market is finally ready to put in a solid rally, and it should be nice and vicious.  A stretch goal for this would be 1200 on the S&P 500, but 1100 or 1150 should be easily reachable.

I’m also seeing good arguments for a much lower target for this market.  For anyone who didn’t do the math, the traditional bottoming PE of 7, applied to the S&P, would suggest a value around 425.  Russell Napier looks at Tobin’s Q ratio to suggest a bottom at 400 around 2014. (In the article a Mr. Brusca feels that this argument is dependent on deflation taking hold, an outcome he feels incredibly unlikely.  I point this out because my expectation has been, and continues to be, for deflation.  We have experienced the largest credit bubble in history, and as it bursts, trillions of dollars in “wealth” will evaporate from the system.)  400 is an awfully steep decline, but if you take another peek at the S&P long-term chart displayed a few posts back, a nice bear market rally approaching 1200 would put in a very nice right shoulder to form a massive head-and-shoulders pattern with a target around 400.  Astute readers will note that Mr. Napier suggests the Fed’s attempts to fight deflation could produce a significant rally (a year or two), much longer than I’m currently expecting, but perfectly in line with such a scenario.

Tanta Has Died

One of the most valuable resources I encountered in the past few years was Tanta, recently co-blogger on Calculated Risk.  I do not remember exactly when I had begun reading CR, but do remember when she had agreed to write for the blog.  She was able to take a normally dry topic and make it incredibly accessible.  I am remembering especially her humor, with references to steel-toed bunny slippers, bourbon slurpees, and delightful metaphors of risk, like this: “Buying a B tranche of a subprime ABS is playing with matches. Buying the equity tranche of a CDO is playing with a blowtorch in the parking lot of the Exxon station while wearing a St. Lucia wreath on your head.”

It is with no surprise I learn she had a graduate degree in English, given her professed fondness for American Lit nerds and literary allusions that I myself would have trouble placing.  Her postings collected in “The Compleat ÜberNerd” should be considered mandatory reading for anyone involved or interested in mortgage origination, servicing, and securitization.  For those of us who follow CR this is a tragic loss, but I am glad that in her last few years she was able to touch so many.  Tanta vive!

http://calculatedrisk.blogspot.com/2008/11/sad-news-tanta-passes-away.html
http://www.nytimes.com/2008/12/01/business/01tanta.html?_r=1
http://www.npr.org/blogs/money/2008/12/on_the_loss_of_tanta_1.html

Adjusting Targets

The week before last saw the market pull a Wiley E. Coyote, slicing through my intermediate target to just below my long term target. When this happens, it’s time to re-examine those targets. The tools for doing so include both traditional fundamental measures, as well as some technical analysis.

What I am currently looking at is the long-term earnings growth of the S&P 500 index (about 6%) and how it relates to current pricing.  In April 2007 Hussman discusses fair value, suggesting 850 as consistent with long-term earnings (a little under 930 today).  I would consider a P/E ratio of 15 (the long term average) to mark “fair value”, and also consistent with the above estimates.  However, markets overshoot.  Historical starting points for secular bull markets have P/E ratios around 7.  I’m willing to be generous and use an estimate of 10, which would imply S&P 500 lows around 600.  Note that P/E ratios may be calculated using either trailing or forward earnings, net or operating earnings, and should be corrected to account for cyclical trends in earnings.  Robert Shiller has suggested techniques for such adjustments.

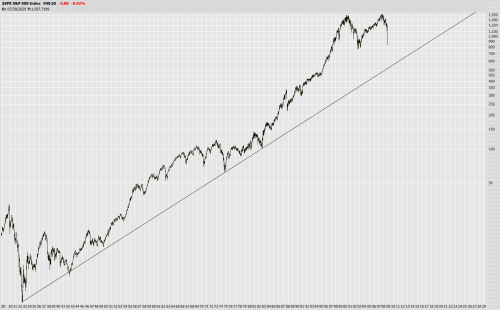
Trend-wise, I would place us in the middle of a secular bear market. This follows the secular bull of ’82 to ’00, which in turn followed the bear of ’66 to ’82, the bull of ’49 to ’66, et cetera. The lifespan of a bear is obviously related to the severity of its losses; most of the damage from a slow sideways grind comes from inflation rather than falling asset prices. I would therefore pick 2014 as a endpoint for a market that trades mostly sideways, and remain open to the idea of steep declines allowing a quicker recovery.

I’ve included below a weekly chart of the S&P 500 for the past 80 years. The long-term trend line presents what I’d like to consider a lower bound.  (As an aside, the trend line approximates annual growth of about 6%.)  I still maintain expectations for a strong rally, possibly preceded by a significant drop, as the most likely outcome over the next few months.

S&P 500

Telling the Truth?

Here is Richard Kovacevich, Chairman of Wells Fargo, telling Maria Bartiromo why his bank is different:

We did not make any No Doc, Low Doc, Option ARMs, Negative Amortization Loans, Stated Income, Teaser Rate ARMs through any subprime borrowers. None.

– Richard Kovacevich, CNBC interview

I believe it is true that they did not offer negatively amortizing products.  I also believe the entire statement can be considered true if you agree with Wells’ ideas as to what constituted “prime”.  Which I certainly don’t.