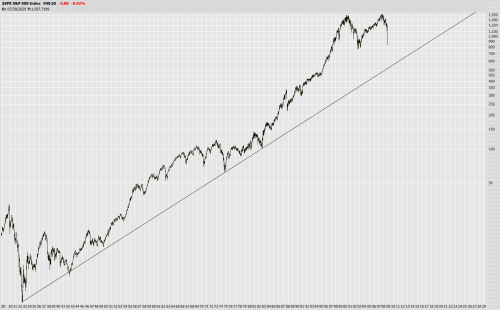
The week before last saw the market pull a Wiley E. Coyote, slicing through my intermediate target to just below my long term target. When this happens, it’s time to re-examine those targets. The tools for doing so include both traditional fundamental measures, as well as some technical analysis.
What I am currently looking at is the long-term earnings growth of the S&P 500 index (about 6%) and how it relates to current pricing. In April 2007 Hussman discusses fair value, suggesting 850 as consistent with long-term earnings (a little under 930 today). I would consider a P/E ratio of 15 (the long term average) to mark “fair value”, and also consistent with the above estimates. However, markets overshoot. Historical starting points for secular bull markets have P/E ratios around 7. I’m willing to be generous and use an estimate of 10, which would imply S&P 500 lows around 600. Note that P/E ratios may be calculated using either trailing or forward earnings, net or operating earnings, and should be corrected to account for cyclical trends in earnings. Robert Shiller has suggested techniques for such adjustments.
Trend-wise, I would place us in the middle of a secular bear market. This follows the secular bull of ’82 to ’00, which in turn followed the bear of ’66 to ’82, the bull of ’49 to ’66, et cetera. The lifespan of a bear is obviously related to the severity of its losses; most of the damage from a slow sideways grind comes from inflation rather than falling asset prices. I would therefore pick 2014 as a endpoint for a market that trades mostly sideways, and remain open to the idea of steep declines allowing a quicker recovery.
I’ve included below a weekly chart of the S&P 500 for the past 80 years. The long-term trend line presents what I’d like to consider a lower bound. (As an aside, the trend line approximates annual growth of about 6%.) I still maintain expectations for a strong rally, possibly preceded by a significant drop, as the most likely outcome over the next few months.

